Turbocharge your development by quickly adding mapping features to your application! GeoView offers extensive map and image file support with "on-the-fly" file translation!
GeoView is an intelligent mapping component for Windows developers who need to quickly embed sophisticated map viewing with spatial overlays in their applications. GeoView allows for a direct display and translation of map layers, without data conversion, as well as providing a layer import interface and a dynamic overlay layer. Most standard vector and image layer formats are supported!
GeoView
Features
GeoView is available as both a dynamic link library (DLL) and an OCX control for Windows programmers using Visual Basic, C++, Delphi, PowerBuilder, C++ Builder, and other Windows development tools.
Maps
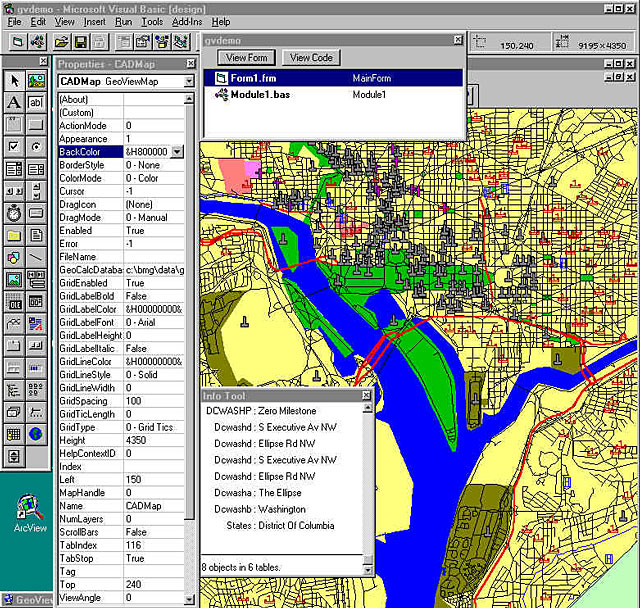
A GeoView map is a composite view of connected map layers, a dynamic overlay layer, and a grid layer. GeoView maps are displayed within an application parent window (within the DLL) or within the OCX control window. GeoView supports a virtually unlimited number of layers within a map which can be tiled and overlaid to produce composite views. You can control map display properties including map center, map scale, map view angle, and the view coordinate system.
Turbocharge your development with GeoView!
Layers
You can directly connect map layers to a map without data conversion. Built-in direct support is provided for many vector and image formats. You can control layer display properties such as visibility and minimum/maximum view scale (zoom layering).
Dynamic Overlay Layer
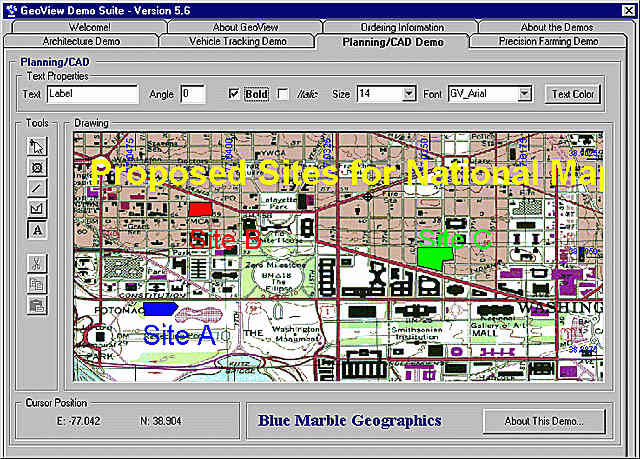
Each map contains a special dynamic overlay layer containing overlay objects (points, lines, polygons, text, circles, and arcs) which you can directly create, manipulate, and destroy. The overlay layer is managed for very rapid drawing and refresh. The overlay layer is designed for intensive object manipulation (GIS/CAD) and real-time applications (vehicle tracking).
Dynamic overlay layer!
Graphics
Point object symbol size can be fixed or scaled automatically depending on the map view scale. Draws lines with selected line color, style, and thickness. Draws polygons with selected fill color, fill style, border line color, line style, and line thickness. Draws text with selected True-Type font, rotation angle, color, size, and style. Text size can be fixed or scaled automatically depending on the map view scale. Overlay objects can contain an associated label. Each overlay object can also contain user-defined persistent data.
Custom Point Objects
GeoView draws points as custom bitmaps stored within a resource-only DLL. You can simply add you own symbols to the resource-only DLL to extend the symbol set provided within GeoView.
Object Handles
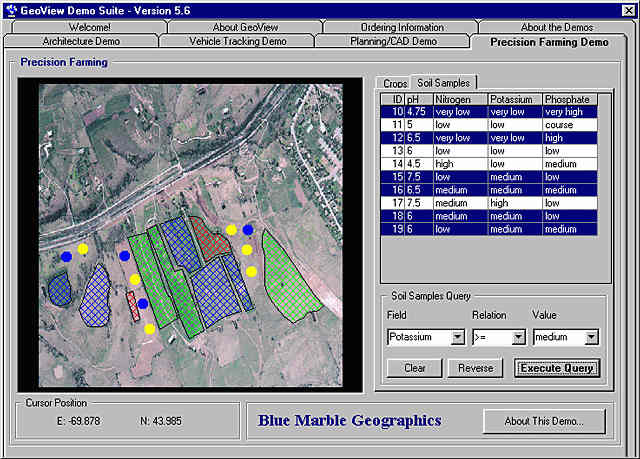
Every GeoView object is assigned a persistent handle when it is created. Powerful systems can be created which access and query databases containing persistent object handle references. The Blue Marble Spatial Database Engine also allows you to store attribute data for objects directly within Blue Marble objects in BML.
Object Query Functions
Supports powerful object query functions. Each function enumerates the object handle(s) and associated layer handle(s) based on a spatial query within a given map.
Object query functions!
Custom Layers and Custom Objects (DLL only)
GeoView implements callback function support for managing and displaying your own layer formats and object types directly. Extend GeoView to support your own custom layers and custom objects.
Map Printing
GeoView outputs the current map view to any Windows-supported printer or to the clipboard for pasting into Windows applications supporting BMP.
On-the-fly Reprojection
GeoView supports over 11,500 coordinate system definitions and on-the-fly coordinate system conversion. You can extend GeoView to support your own coordinate systems. Connected layers are projected on-the-fly into the map view coordinate system.
Royalty-free Map Data
Over 550 MB of map data is included that you can distribute with your application.
Of course, GeoView supports industry standard map data formats directly, without conversion.
GeoView
Details
Map File Formats
AutoCAD R14 DWG/DXF
ESRI Shape
MapInfo MIF
Microstation DGN (2D only)
Vector Product Format (VPF)
Supported Image Formats
TIFF
Windows Bitmap
JPEG
BSB Chart (read only)
ADRG (read only)
Coordinate Conversion Parameters
We include a comprehensive coordinate conversion parameter database that contains most common coordinate systems in use throughout the world. You can completely customize this file (a simple text file of 150 KB) by adding or removing parameters. Currently, the coordinate conversion database contains:
over 165 ellipsoids
over 630 datum transformations
over 30 linear units
7 angular units
many, many coordinate system definitions.
Common coordinate systems included are:
US State Plane 1927 (both original and exact solutions)
US State Plane 1983
UTM (Universal Transverse Mercator) North and South zones
Gauss-Kruger Modified, 3TM, and 6TM
XYZ Cartesian ECEF
XYZ Cartesian Eath-Centered Earth Fixed (ECEF)
New Zealand Map Grid
Grids for Argentina, Australia, Austria, Bahrain, Belgium, Borneo, Columbia, Cuba, Egypt, England, France, Ghana, Greece, India, Iraq, Ireland, Italy, Japan, Minnesota, Netherlands, New Brunswick, New Zealand, Nigeria, Peru, Phillipines, Qatar, Quebec, Rumania, Veracruz, and many more. More are being added all the time!
Map Projections
Albers Equal-Area Conic
Azimuthal Equal Area
Azimuthal Equidistant
Bonne
Cassini
Double Stereographic
Equal-Area Cylindrical
Equidistant Conic
Equidistant Cylindrical
European Stereographic
Gnomic
Hotine Oblique Mercator (Rectified Skew Orthomorphic - with the Skew Angle parameter)
IMW Polyconic
Lambert Conformal Conic (1 parallel)
Lambert Conformal Conic (2 parallel)
Mercator
Miller Cylindrical
Mollweide
Orthographic
Polar Azimuthal
Equal Area
Polar Azimuthal Equidistant
Polar Stereographic
Polyconic
Robinson
Sinusiodal
Space Oblique Mercator
Stereographic
Stereographic 70
Transverse Mercator (Gauss-Kruger)
Two-Point Fit (a special polynomial projection)
Van der Grinten
Datum Transformations
Molodensky
Bursa/Wolfe
DMA MRE
NADCON
HPGN
Canadian National Transformation V2
GeoView
Who's Using GeoView
We have over 120,000 customers around the world, here are just a few:
Nasa
Ericcson
Lucent
The FAA
The National Park Service
Chevron - Texaco
Boeing
Shell
Exxon-Mobil
Thales Geosolutions
Lockheed Martin
Oracle
British Geological Survey
BP Amoco
Harvard University
Yale School of Architecture
Yale University
Princeton University
Domino's Pizza
User Comments
"GeoView is a powerful and important component in Smallworld's product range for customers who need to view legacy data. Smallworld has licensed Blue Marble's GeoView technology to provide integration of various GIS, raster and graphics data formats within the Smallworld environment using GeoView incorporated as a spatial object manager (SOM). The Smallworld GeoView SOM opens the way to in situ integration of legacy GIS data, as well as use of off-the-shelf data published in industry standard formats. The benefit? End users do not have to lose their sizable investment in legacy forms of data, allowing their investment to be extended indefinitely."
D. Theriault - Product Marketing Manager, Smallworld
"With GeoView, we found an open interface design, lightning speed, and most important, effective engineering support. Blue Marble really helped shorten the time to market for RASTrac!"
J. Manning - President, Manning NavComp
"Rapid and personal technical support has been incredibly helpful. By embedding Blue Marble components, we are presented with a great opportunity here at the DOC to streamline field operations to eliminate tedious field work."
Q: What are the differences between GeoView and GeoObjects?? A: In general, you should choose our GeoView tool if you want to view many standard map file formats, including images in the background, with spatial annotation.
You should choose our GeoObjects? tool if you need to shade maps thematically based on attribute data in order to spatially enable your database.
GeoObjects? is a "bound" control that automatically shades maps based on attribute data in a database.
Both products have a dynamic overlay layer for spatial annotations, overlay object creation and editing, GPS animation, etc.
GeoObjects? supports the native MapInfo (TAB) file format.
GeoView supports the MapInfo MIF format.
GeoObjects? supports the native ESRI Atlas GIS (AGF) file format.
Both products support the ESRI (SHP) and AutoCAD (DWG and DXF R14 or earlier) file formats.
GeoView supports the Microstation (DGN) file format.
GeoView supports the Vector Product Format (VPF).
GeoView displays raster image formats in the background.
Both products resolve multiple coordinate systems "on-the-fly".
GeoObjects? is available as an OCX (ActiveX) control. GeoView is available both as a DLL and an OCX control.
The GeoView DLL allows you to define your own layer and object types.
GeoView supports file format translation (for example, DWG to MIF).
Q: What is the BMGObjectClassFilter and how is it used? A: The BMGObjectClassFilter is a layer property that determines whether objects in that layer are drawn or not drawn and thus visible or not visible in the GeoView display. BMGObjectClassFilter is an array of 256 bytes (0 to 255). By default each element in the byte array is set to '1' or 'on' (visible) in the BMGObjectClassFilter. This filter is used in conjunction with the class property of a blue marble objects to 'filter' or turn objects on or off. By default the class property of an object is set to '0'. The class property can be set as an integer from 0 to 255. So again by default all objects are drawn because all objects are created with the class of 0 and the BMGObjectClassFilter[0] = 1 or visible. If the value in BMGObjectClassFilter[0] was set to '0' and the layer redrawn then all the objects with class of 0 would not be drawn.
Q: How can I assess the display speed of the various file formats within GeoView? A: Simply download Geographic Transformer and run it in evaluation mode. Most Blue Marble applications allow for FREE display of most raster and vector formats. The Geographic Transformer is the one application that allows you to display DXF/DWG, DGN, MIF, TAB, VPF and ESRI Shape as an overlay to raster files such as TIFF, BMP, JPG, ADRG and NOAA (BSB) electronic charts.
Q: I need to display hot spots on a CAD drawing (DWG or DXF) with several layers that can be turned on or off (i.e. a name layer and a size layer). When clicking on these hot spots I need the ability to call information from an access database, as well as the ability to paint the hot spots on the drawing with several colors using information from this database. Can I do all this with GeoView? A: Yes, you can accomplish this with GeoView. GeoView allows you to directly query the object record number in the native file format.
Q: What do you mean by "coordinate system conversion" and "layer conversion"? A: Coordinate System Conversion means that you may have map data files that are each in different coordinate systems. Each will be reprojected on the fly into the map view coordinate system.
Layer Conversion means that you can translate from one file format to another using the GeoView_LayerConvert method.
Q: Does GeoView support more than one method of zooming a map display (e.g. zoom by clicking on a point zoom by dragging a box)? A: Yes, zoom box, zoom area, zoom center, zoom factor, zoom by coordinate, zoom previous, zoom by scale. Also, a sequence of zooms be remembered so the user can un-zoom. GeoView stores the ViewScale property of the map. Your application "un-zooms" by calling GeoView_SetViewScale( hMap, dOldViewScale ) function or gvMap.SetViewScale( dOldViewScale ) method.
Q: Can a map display be panned by dragging the map itself? I have seen applications where a hand icon is used to move a map around within the map view window. A: Yes. GeoView has a SetViewCenterX and SetViewCenterY functions that can be used to do this type of panning. First you save the current ViewCenter of the map. Second, you calculate the difference between Point1 ( when you start dragging i.e. mouse down ) and Point2 ( when you end dragging i.e. mouse up event. ) Third, apply the difference in X direction and the difference in Y direction to the current ViewCenterX and ViewCenterY. Finally, use the SetViewCenterX and SetViewCenterY functions to specify the new center position of the map. When the map is panned GeoView " redraws" when the pan is finished. When the ViewCenter is changed, the map must be redrawn.
Q: Does GeoView support the Universal Transverse Mercator (UTM) grid? A: Absolutely. If you download any of our Application Tool products and run them in evaluation mode, you will be able to see what coordinate systems, datum, and projections are support in the dialogs. The Geographic Transformer is the best at showcasing this and will give you a free look a how GeoView can be used to display raster and vector files.
Q: What is a GeoView map and how do I view my data in a GeoView map? A: A "map" is a collection of "data layers". In order to display your data layer, such as an ESRI Shape file, you first need to create a "map" using the Create method. The Create method specifies a BMM file (Blue Marble Map file). The "map" created consists of four files, for example, myMap.bmm, myMap.md1, myMap.md2, and myMap3.md3. GeoView stores map properties like ViewScale, MapExtents, ViewCenterX, ViewCenterY, paths of layers connected and so on....in these four files. At this point you will not be able to see anything in the map because you do not have any data associated with the map. Use the LayerConnect method to attach data layers to your map. For example, connect your Shape file specifying the path of the .SHP and .SHX files. For more specific information on Create and LayerConnect please review the GeoView help file and Step 1 of the GeoView tutorial. GeoView automatically saves information to the BMM, MD1, MD2, and MD3 files. Call the Close method to shutdown GeoView.
Now if you want to view that map again you use the Open method. The parameter of the Open method is the name of the BMM file, i.e. MyMap.BMM. The map will open with all the data layers connected in the previous session plus return to the state at which you Closed the map. In closing, the map is a container for vector and raster data layers.
Q: How is ViewScale defined? A: GeoView's ViewScale is rooted in meters. Internally, the ViewScale is calculated using meters thus the "units" of the ViewScale are MapUnits/meter on the screen. The following shows a State Plane coordinate example and Lat/Lon example.
State Plane Coordinate System Defined
Assume:
Width of Screen in map units = 300,000 meters
Width of Screen in meters = 0.160 meters


 Turbocharge your development with GeoView!