Have you ever been faced with a complex, multi-stage decision like what is the best strategy for testing and drilling for oil, or should we build a new plant or buy an existing one? What about bidding on a new project ? what should you bid, and how should you react to your opponent’s bid? Or perhaps you are faced with determining the best litigation strategy is in a legal dispute, or the best series of medical tests and procedures to maximize a patient’s chance of recovery?
PrecisionTree helps you tackle these types of complex, sequential decisions. With PrecisionTree, you can visually map out, organize, and analyze decisions using decision trees, right in Microsoft Excel. Decision trees are quantitative diagrams with nodes and branches representing different possible decision paths and chance events. This helps you identify and calculate the value of all possible alternatives, so you can choose the best option with confidence.

New PrecisionTree version 6 now performs Bayesian revision on your trees with the click of a button. This lets you “flip” one or more chance nodes in a model in order to show probabilities calculated using Bayes’ Rule. This is valuable when the probabilities of a model are not available in a directly useful form. For example, you may need to know the probability of an outcome occurring given the results of a particular test. The test’s accuracy may be known, but the only way to determine the probability you seek is to “reverse” a traditional tree using Bayes Rule. Now in PrecisionTree, this process is easy.
PrecisionTree 6 also provides a range of enhancements that make tree construction and editing much faster and easier. You can append symmetric subtrees with a single click, insert new nodes between existing nodes easily, and copy and paste subtree images into Word, PowerPoint, or other reports.
INDUSTRY
DEFENSE
ENGINEERING
ENVIRONMENT
Case Studies
FINANCE AND SECURITIES
Case Studies
GOVERNMENT
HUMAN RESOURCES
INSURANCE
MEDICAL / PHARMACEUTICAL / HEALTHCARE
Case Studies
OIL/GAS/ENERGY
Case Studies
TECHNOLOGY
Case Studies
SAMPLE APPLICATION
War and engagement modeling
Earthquake and disaster planning
Structural planning and integration
Resource management
Preservation programs
Portfolio selection
Real options analysis
Budget planning
Capital projects
Job classification
Applicant evaluation
Applicant classification and evaluation
Medical diagnosis
Vaccination and treatment planning
New product analysis
Exploration and production
Wildcatting
Drilling and well development
Speech recognition
IT systems integration
Customer support
|
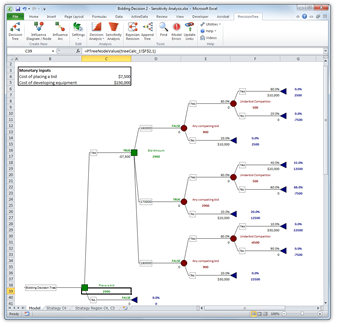
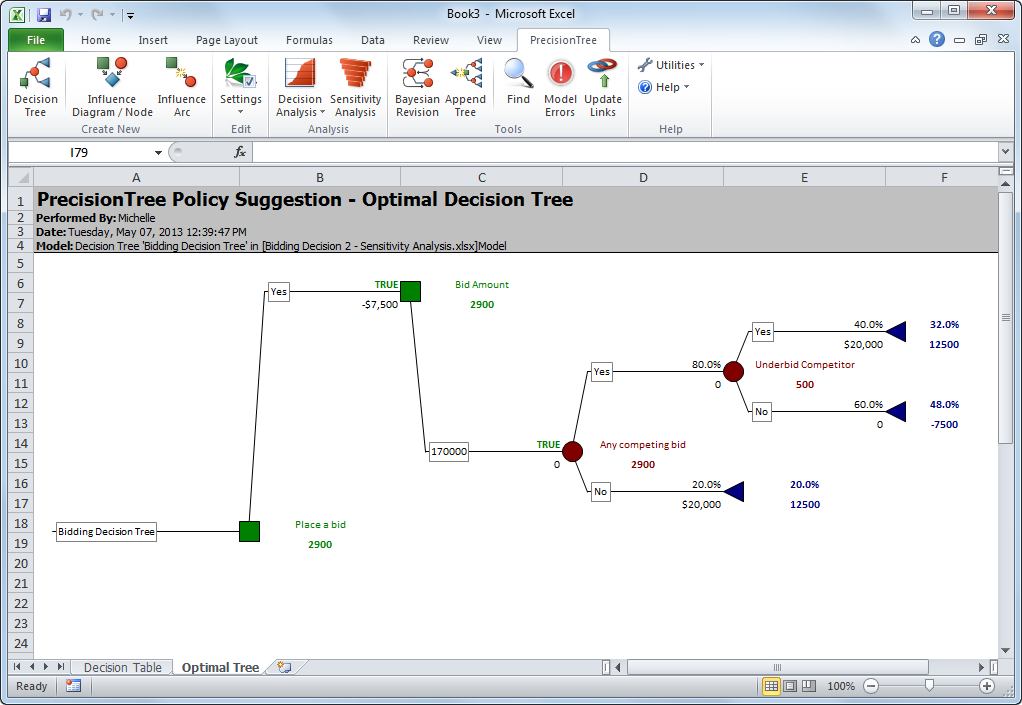
Decision trees provide a formal structure in which decisions and chance events are linked in sequence from left to right. Decisions, chance events, and end results are represented by nodes and connected by branches. The result is a tree structure with the "root" on the left and various payoffs on the right. Probabilities of events occurring and payoffs for events and decisions are added to each node in the tree. With PrecisionTree, you’ll see the payoff and probability of each possible path through a tree.
PrecisionTree functions may be added to any cell in a spreadsheet and can include arguments that are cell references and expressions - allowing great flexibility in defining decision models. You can also collapse and restore branches to the right of any given node for simplicity and easier navigation through the tree, and insert nodes at any point in a tree. You can even append symmetric subtrees to particular nodes, greatly speeding up the building of large models.
PrecisionTree determines the best decision to make at each decision node and marks the branch for that decision TRUE. Once your decision tree is complete, PrecisionTree’s decision analysis creates a full statistics report on the best decision to make and its comparison with alternative decisions.
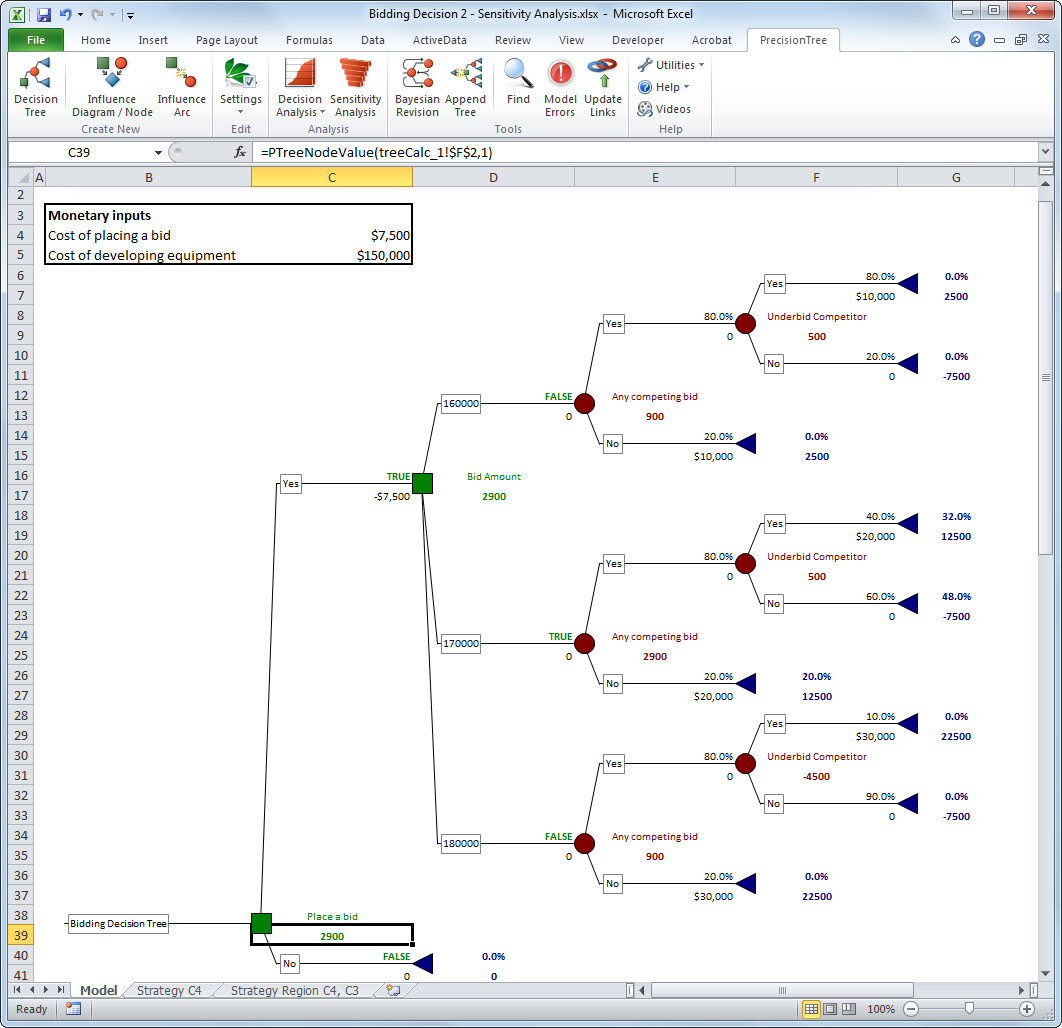
PrecisionTree can create a Risk Profile graph that compares the payoffs and risk of different decision options. It displays probability and cumulative charts showing the probabilities of different outcomes and of an outcome less than or equal to a certain value.
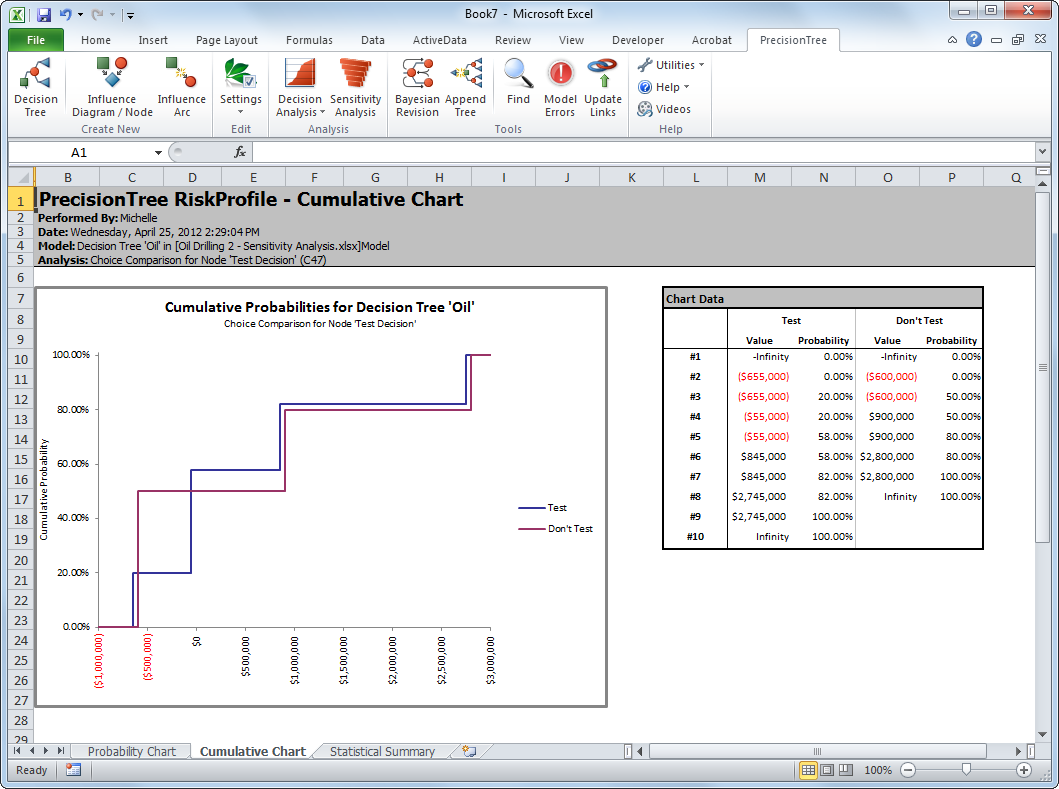
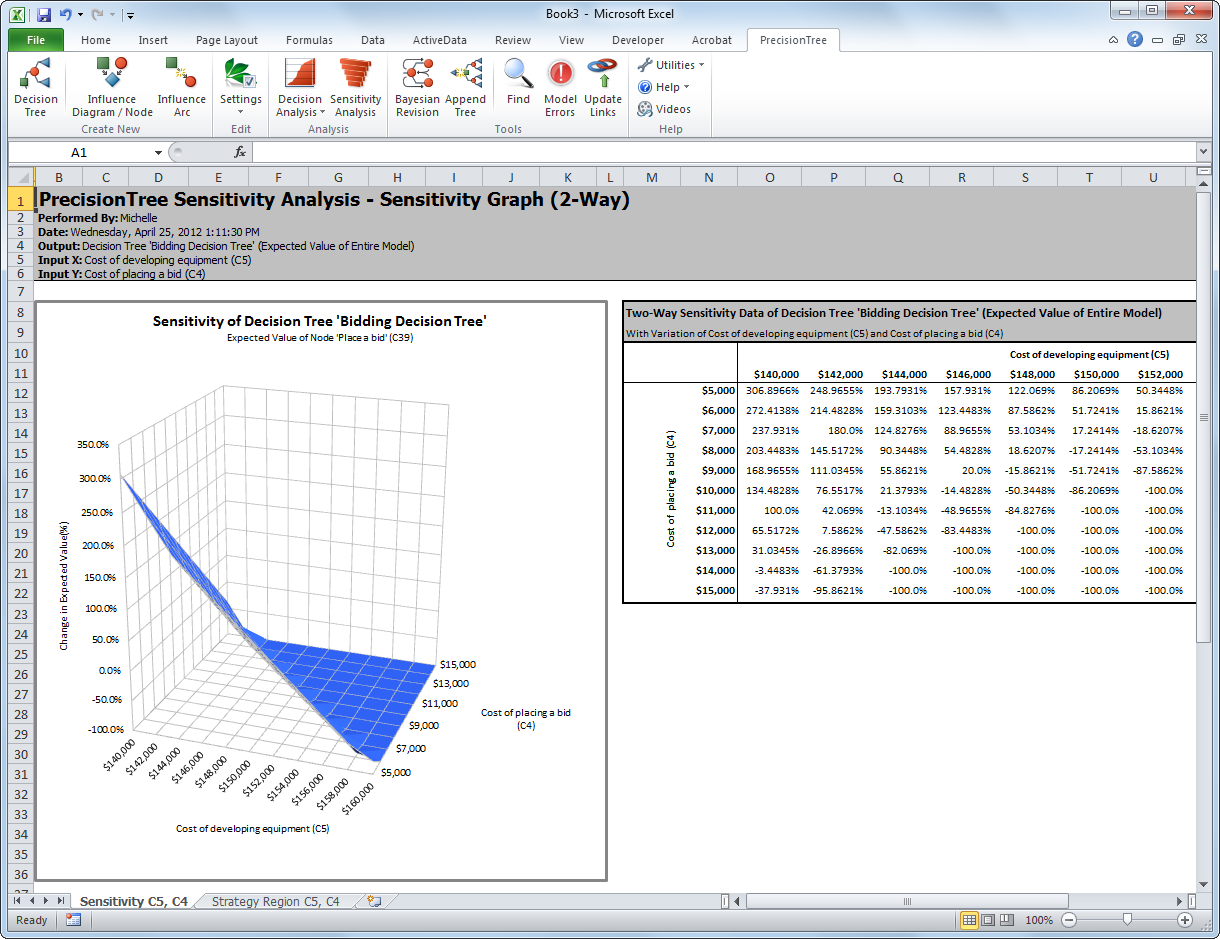
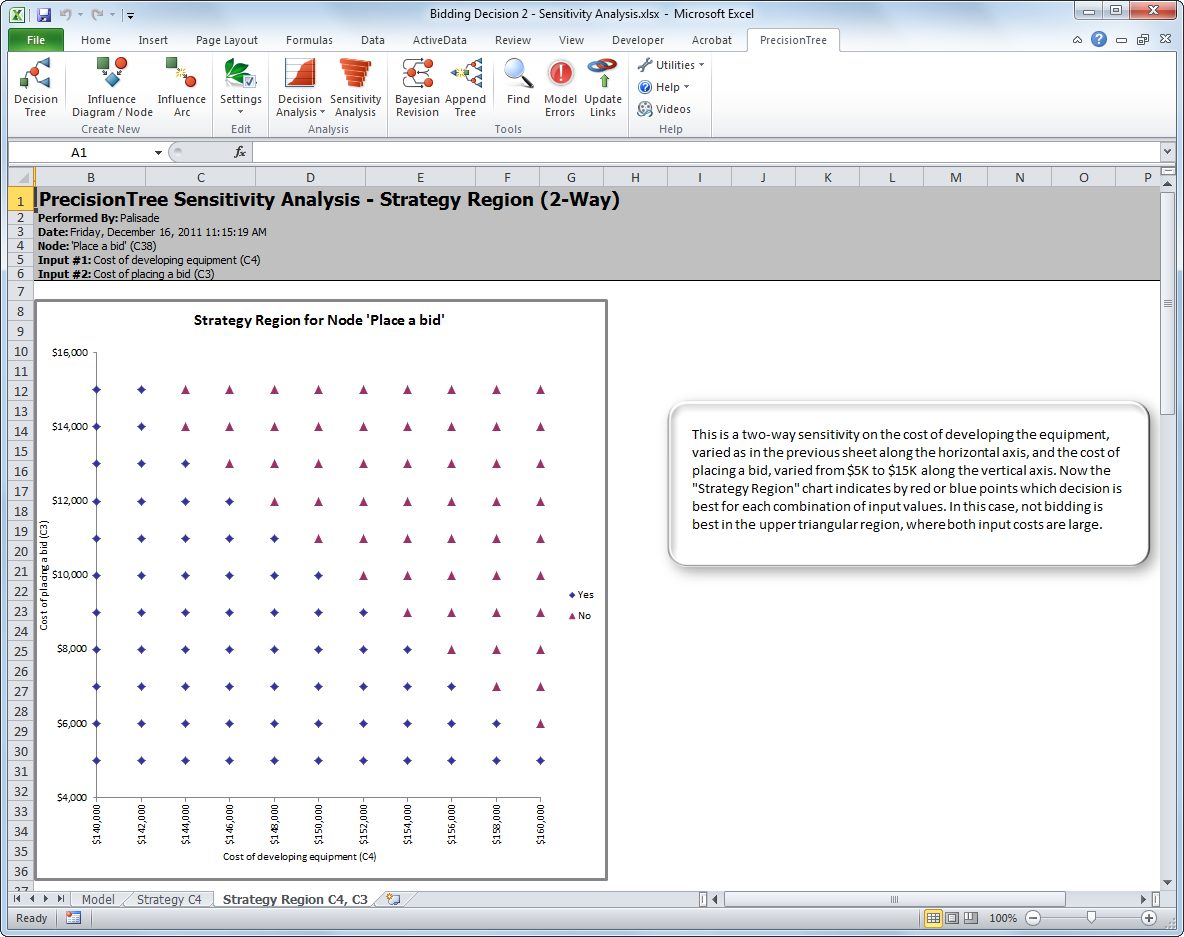
PrecisionTree can also perform a sensitivity analysis by modifying the values of the variables you specify and recording the changes in the expected value of the tree. You can change one or two variables at a time. Results include sensitivity, tornado, spider, and strategy-region graphs.
Policy Suggestion Report – A reduced version of the decision tree that displays only the optimum decisions in your model. It includes a Policy Decision Table which lists each decision in a model, the probability of arriving at that decision, and the benefit of making the correct choice for that decision.
Strategy Region Graphs – One-Way Strategy Region graphs display the expected values for each decision over the range of one variable. Two-Way Strategy Region graphs show you which decision is optimal over the range of two variables.
Unlimited tree nodes – For your largest models, PrecisionTree Industrial allows decision trees of unlimited size.
Bayesian Revision ? This lets you to “flip” one or more chance nodes in a model in order to show probabilities calculated using Bayes’ Rule. This is valuable when the probabilities of a model are not available in a directly useful form. For example, you may need to know the probability of an outcome occurring given the results of a particular test. The test’s accuracy may be known, but the only way to determine the probability you seek is to “reverse” a traditional tree using Bayes Rule.
Logic nodes ? A special type of node where the optimum branch is selected according to conditions the user defines. A logic node behaves like a decision node, but it selects the branch whose branch logic formula evaluates to TRUE as the logical (optimum) decision.
Reference nodes ? Are used to reference a sub-tree. The sub-tree can be on any sheet in the workbook. Use reference nodes to simplify a tree, to reference the same sub-tree many times in a tree, or to build a tree that’s too large to fit on one spreadsheet.
Linked Trees ? Allow the branch values for a decision tree to be linked to cells in an Excel model external to the tree. Each node can be linked to an Excel cell reference or range name. End node payoffs can be calculated by a detailed spreadsheet model. This powerful feature combines the strength of a decision tree for describing decision situations with the strength of a traditional spreadsheet model for calculating results.
Payoffs with VBA Macros ? PrecisionTree can calculate decision tree path payoff values using a custom VBA formula. Using this method, you can drastically simplify your models.
Custom Utility Functions ? Converts a model’s monetary payoffs into “utility” to account for the decision maker’s attitude toward risk, which can affect the optimal decision choice. PrecisionTree offers a default exponential utility function, but, using VBA custom functions, you can easily construct your own custom utility function.
PrecisonTree Developer Kit ? Built-in programming language that allows you to automate PrecisionTree using Excel VBA.
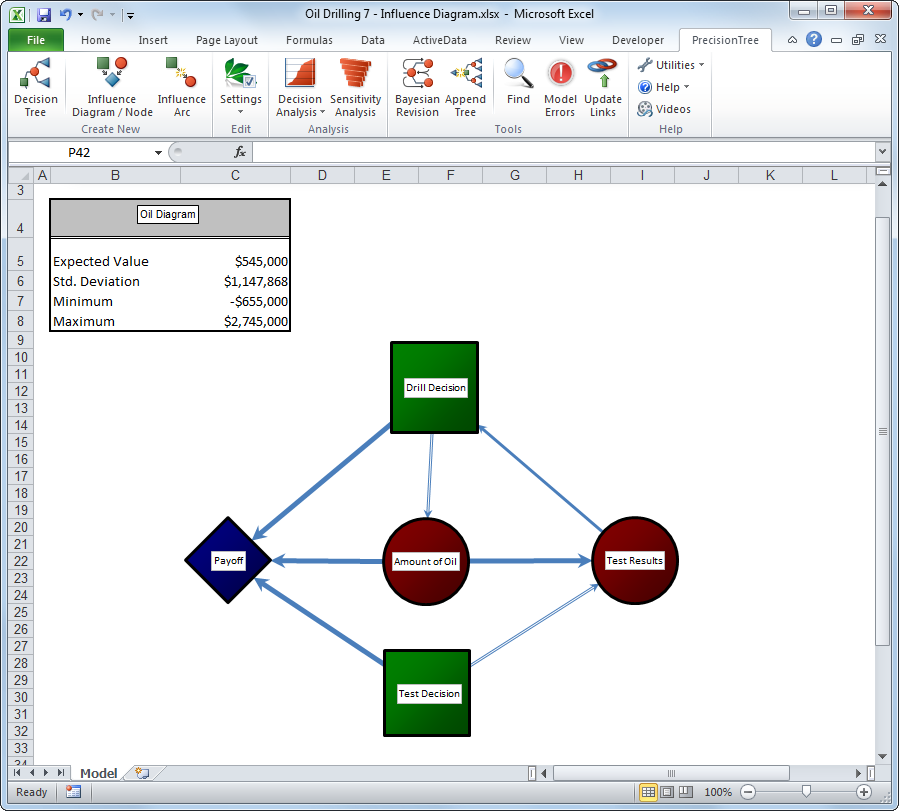
Influence Diagrams ? Using nodes and arcs, influence diagrams are used to summarize the general structure of a decision. They can also represent asymmetric trees. You can convert influence diagrams into decision trees.
PrecisionTree is a true add-in to Microsoft Excel, integrating completely with your spreadsheet. Browse, define, analyze?while never leaving Excel. PrecisionTree nodes, branches, and arcs are placed directly in your model, and values appear in the formula bar. Context-sensitive right-click menus and the PrecisionTree toolbar make learning and navigating PrecisionTree a snap.
Decision trees
Influence diagrams
Risk profile reports
Sensitivity analysis
Compatibility with @RISK
Variety of advanced features
Policy Suggestion Report
Strategy Region Graphs
Bayesian Revision
Number of Tree Nodes
PrecisionTree Professional
•
•
•
•
•
•
•
•
•
1000
PrecisionTree Industrial
•
•
•
•
•
•
•
•
•
Unlimited
|
FEATURES
Decision trees
Seamless integration into Microsoft Excel
Intuitive toolbars and right-click menus
Risk profile reports
Sensitivity analysis
Policy Suggestion Report
Strategy Region Graphs
Bayesian Revision
Reference nodes and collapsible branches
Logic nodes
Linked trees and VBA payoff calculations
Utility functions
PrecisionTree Developer Kit
Compatibility with @RISK
Influence diagrams
BENEFITS
Visually understand a decision, identify best options, and communicate results to others
Never leave your spreadsheet; get up to speed quickly
Easy navigation?multiple ways to perform common tasks
Shows payoffs and risks of different options
Identifies most influential variables in a decision
Shows optimal decisions and payoffs
Displays value of decisions over ranges of 1 or 2 variables
Reverses chance nodes to show probabilities calculated using Bayes Rule
Streamline large trees for easy navigation
Allows conditional modeling
Allows complex payoff computations outside of the tree itself
Account for decision maker’s attitude toward risk when calculating the best decision
Automate and customize PrecisionTree with Excel VBA
Account for uncertainty and run Monte Carlo simulations to see all possible outcomes
in your tree
Visually summarize a decision
|
PrecisionTree is available by itself or as part of the DecisionTools Suite, Palisade’s complete risk and decision analysis toolkit. The DecisionTools Suite includes @RISK, which adds risk analysis to Excel using Monte Carlo simulation, TopRankfor what-if analysis, NeuralTools and StatTools for data analysis, and more. DecisionTools Suite components are compatible with each other can be combined for greater insight and analysis. For example:
PrecisionTree and @RISK
PrecisionTree represents chance events and payoffs with discrete values or probabilities. When combined with @RISK, @RISK enhances the analysis by representing continuous ranges of outcomes for chance events and payoffs. By running Monte Carlo simulation on your decision tree, you'll see more possible outcomes of your decision than you could with static tree values alone.
PrecisionTree and TopRank
PrecisionTree models can also be run with TopRank to identify the most critical factors in larger, more complex tree models. TopRank performs sensitivity analysis on your tree.
PrecisionTree is available through a variety of licensing options, including corporate, network, and academic licenses. Training, consulting, and books can be bundled with your software to ensure you and your staff get the most out of your investment.
PrecisionTree calculations are performed 100% within Excel, supported by Palisade sampling and statistics proven in over twenty years of use. Palisade does not attempt to rewrite Excel in an external recalculator to gain speed. A single recalculation from an unsupported or poorly reproduced macro or function can dramatically change your results. Where will it occur, and when?
COMPATIBILITY: @RISK and DecisionTools Suite software is compatible with all 32-bit and 64-bit versions of Microsoft Windows XP-8, Excel 2003-2013, and Project 2003-2013.
64-bit technology enables Excel and DecisionTools software to access much more computer memory than ever before. This allows for vastly larger models and greater computational power.