| |
 |
| |
| 아래 제목을 클릭하면 자세히 보실 수 있습니다. |
|
| |
|
|
|
Contour Maps |
|
| |
Surfer의
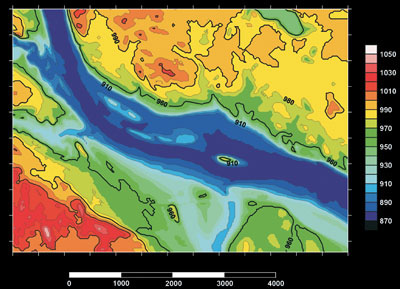
Contour Map은 모든 Map 파라미터들을 조절할 수 있습니다. Contour Map을
자동으로 생성하는 Surfer의 지능적인 기본 설정을 이용하여 Contour Map을 자동으로
생성 하거나 더블 클릭하여 Map의 특징을 사용자가 설정할 수 있습니다. 특정 Contour
영역과 간격 위에 Contour Map을 디스플레이 하거나 여러분이 지도상에 표시하고자 하는
Contour Level을 정할 수 있습니다. Contours사이에 색을 채워서 여러분의 지도를
멋지게 표현할 수 있고 혹은 그레이스케일로 채워서 인상적인 흑백 출력을 할 수 있습니다.
|
| |
 |
| |
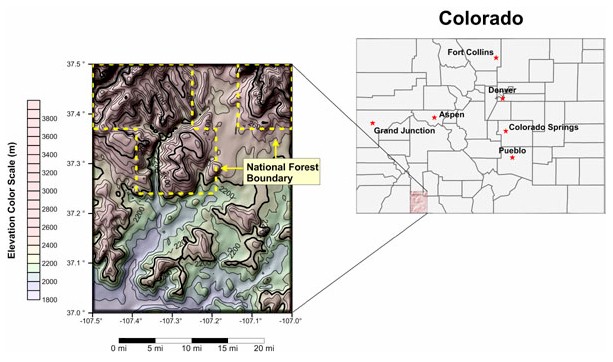
USGS
DEM(Morrison, CO Quadrangle)을 이용하여 위의 Contour Map을 만들었습니다.
오른쪽 그림은 왼쪽 그림의 사격형 부분을 확대한 것입니다. |
| |
Contour
Map 관련 기능들
|
- Automatic or user-defined contour intervals and ranges
- Full control over contour label format, font, frequency, placement, and spacing
- Drag contour labels to place them exactly where you want them
- Automatic or user-defined color for contour lines
- Color fill between contours, either user-specified or as an automatic spectrum of your choice
- Save and retrieve custom line styles and fills for contour maps
- Full control over hachures
- Regulate smoothing of contour lines
- Reshape contour lines
- Blank contour lines in areas where you don't want to show any data
- Specify color for blanked region
- Rotate and tilt contour maps to any angle
- Add color scale or distance scale bars
- Independently scale in the X and Y dimensions
- Full control over axis tick labels, tick spacing, grid lines and titles
- Create any number of contour maps on a pag
- Print maps in black-and-white or full color
- Overlay base, vector, shaded relief, image, or post maps on contour maps
- Drape contour maps over 3D surfaces for dramatic displays
- Export contours in 3D DXF and 3D SHP format
|
|
| |
 |
| |
| 각 Contour 라벨을 드래그하여 새로운 위치로 이동할 수 있고, 각 라벨을 삭제할 수 있음. |
|
|
| |
|
3D Surface Maps |
|
| |
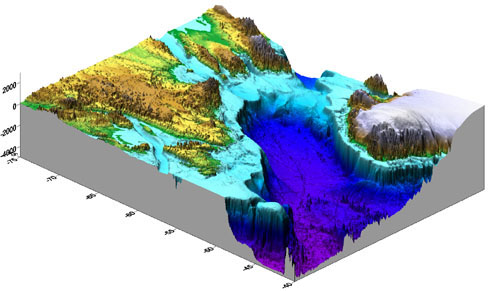
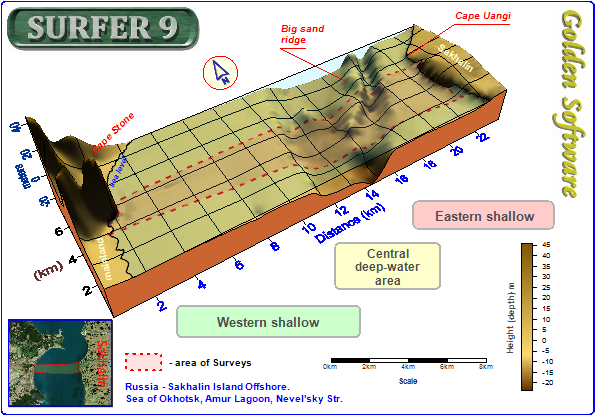
| 3D
Surface Map은 음영 및 칼라 기법을 활용하여 데이터의 특징을 강조하여 묘사할 수 있습니다. 광원,
각도, 기울기 등을 단 한번의 마우스 클릭으로 변경할 수 있습니다. 보다 많은 정보를 담은 블록 선도(Block
Diagram)을 생성하기 위해 다수의 Surface를 중첩하여 도시할 수 있습니다.
|
| |
 |
| |
| USGS 위 그림은 Surface Map을 중첩 도시한 예로 지질학적 특징을 잘 묘사하고 있습니다. |
| |
Contour
Map 관련 기능들
|
- Specify surface color gradation, shininess, base fill and line color
- Control mesh line frequency, color, style, surface offset
- Set lighting horizontal and vertical angles, ambient, diffuse, and specular properties
- Overlay contour maps, image maps, post maps, shaded relief maps, raster and vector base maps, and other surface maps for spectacular presentations
- Change View tilt, rotation, field of view angles, perspective or orthographic projection
- Set XYZ scales in map units or page length, choose proportional or independent XY scaling
- Use data XY limits or specify a subset of the map
- Control background fill and line color and styles
- Add color scales to explain the data values corresponding to each color
- Disable the display of blanked grid nodes or map the blanked areas to a specific Z level
- Produce a detailed report of the grid statistics
- Substitute a new grid file into an existing map
|
|
| |
 |
| |
| XYZ 데이터로부터 흥미로운 3D Surface 맵을 만들어 보세요! |
 |
| |
| 심도(depth)에 따른 변화를 모사하기 위해 서페이스 맵들을 중첩한 사례 |
|
|
|
Image Maps |
|
| |
Surfer의 Image Map은 다른 색상을 이용하여 그리드 파일의 고도를 표현합니다. 다양한 그리드 파일 포맷을 지원합니다.(GRD, DEM, SDTS DDF, GTOP30 HDR, etc). Surfer는 비율 값 사이의 색상을 자동으로 혼합하여 지도상의 색의 변화를 부드럽게 처리해 줍니다. 0과 100 사이의 어떤 퍼센트의 점에도 Color Anchor를 추가할 수 있습니다. 각 Anchor point는 특정 색으로 할당될 수 있습니다. 그리고 색들은 인접한 Anchor points 사이에서 자동으로 혼합되어 조화를 이룹니다. 이러한 기능은 어떤 색의 조합으로든 칼라 맵을 만들 수 있게 해 줍니다.연관된 그리드 파일들이 전혀 다른 Z range을 다루더라도 특정 Image Map을 위해 여러분이 선택한 어떤 칼라를 다른 Image Map과 함께 사용할 수 있습니다. Image Maps은 다른 Maps들과 무관하게 독립적으로 만들 수 있으며, 또는 다른 Maps에 병합될 수 도 있습니다. Image Maps은 축척과 크기를 조절할 수 있고 제한을 두거나 이동시킬 수도 있습니다,
|
| |
 |
| |
| 여러분의 이미지 맵에 색상을 입히고 색을 조절할 수 있습니다. |
 |
| |
Image Map관련 기능들 |
- Pixel maps or smoothed images
- Dither bitmaps if needed
- Create an associated color scale
- Create custom color spectrum files for use on any image or shaded relief map
- Overlay image maps with contour, post, or base maps
- Data-independent color spectrum file
- Specify color for missing data
- Change the rotation and tilt angles
|
|
|
|
|
Shaded Relief Maps |
|
| |
Surfer의 Shaded Relief Maps은 그리드(.GRD) 파일이나 USGS DEM으로부터 입체적인 음영기복도를 만들 수 있습니다. 이러한 지도들은 사용자가 정의한 광원의 방향과 연계되어 표면의 경사와 경사 방향을 표현하기 위해 다른 색들을 사용합니다. Surfer는 표면에 있는 각각의 그리드의 방위(Orientation)을 결정하고 각 그리드의 셀에 고유의 색을 할당해 줍니다. 음영기복도상의 색상들은 표면에 비취는 빛과 연관됩니다. 광원은 지표면을 비추는 태양으로 간주할 수 있습니다. Surfer는 비율 값(Percentage Values) 사이의 색들을 자동으로 혼합하여 지도위의 색의 변화를 부드럽게 처리해 줍니다. Color Anchor Points를 추가하여 각 Anchor Point에 고유의 색을 할당할 수 있습니다. 인접한 Color Anchor Points사이에 색들이 자동으로 혼합됩니다. 이러한 기능은 어떠한 색의 조합으로든 Color Map을 만들 수 있게 합니다. 음영기복도는 다른 지도들과 독립적으로 만들 수 있고, 지도 중첩(Overlay Maps 명령)을 이용하여 다른 지도와 병합할 수도 있습니다. 다른 종류의 지도와 마찬가지로 동일한 방법으로 음영 기복도의 축척과 크기를 조절할 수 있고 제한을 하거나 이동할 수 있습니다.
|
| |
 |
| |
| 음영기복도와 Contour 및 기본 맵 특징을 함께 도시한 예 |
| |
Shaded Relief Map관련 기능들 |
- Create photo-quality relief maps from grid files
- Control light source position, relative slope gradient, and shading
- Use custom color spectrum files for the exact desired display
- Overlay with contour, vector, post, or base maps for highly effective displays
- Shading calculations based on several shading methods, including Simple, Peucker's Approximation, Lambertian Reflection, and Lommel-Seeliger Law
- Set relief parameters using Central Difference or Midpoint difference gradient methods
- Specify color for missing data
- Change the rotation and tilt angles
|
|
|
|
|
Based Maps |
|
| |
Surfer는 매우 많은 종류의 포맷 형식의 지도를 읽어 지형 정보를 표시할 수 있습니다. 지도 중첩 기능을 이용하여 기본 맵(Base Map)위에 다른 맵들을 함께 도시할 수 있습니다. 혹은 같은 페이지에 다른 맵과는 무관하게 독립적인 기본 맵을 제작할 수도 있습니다. 한 페이지에 다수의 기본 맵을 불러올 수 있습니다. 기본 맵은 DXF, GSI, BLN, SHP, LGO, BNA, GSB, DLG, LGS, MIF, E00, USGS SDTS DLG DDF, EMF, WMF, TIF, PCX, BMP, PLT, CLP, TGA, PCX, JPG, PNG, DCX, WPG, PCT을 포함하여 이외의 다양한 파일 형식들을 읽을 수 있습니다. Contour 혹은 Surface Wireframe 맵과 기본 맵을 중첩하는 것은 매우 쉽고, 3차원 데이터 조합의 지형 정보를 표시할 수도 있습니다.
|
| |
 |
| |
| Base map을 단독으로 표시하거나 다른 지도와 함께 중첩하여 표시할 수 있습니다. |
| |
Base Map관련 기능 및 특징 |
- Create any number of base maps on a single page
- Create independent base maps or overlay base maps on other map types
- Edit line, fill, text, and symbol properties for vector base map formats
- Specify real-world coordinates for TIF, JPG, GIF, and other raster files
- Independent scaling in the X and Y dimensions
- Rotate and tilt base maps to any angle
|
|
|
|
|
Post Map |
|
| |
Surfer의 Post Maps은 고정 크기의 심볼 혹은 칼라의 심볼 크기에 비례하여 X, Y의 위치를 표시합니다. 해당 페이지에 다른 맵들과 독립적으로 Post Maps을 만들거나 Contour, Vector, Surface 등과 같은 기본 맵위에 중첩 표시할 수 있습니다. 표시점의 심볼, 레이블 타입, 크기 와 각도를 설정할 수 있습니다. 또한, 각각 다른 범위에 속하는 데이터 다른 심볼과 칼라를 자동으로 지정하여 데이터의 다른 영역들을 식별하는 분류화된 Post Map을 작성할 수 있습니다. Contour Map위에 여러분의 원시 데이터의 위치를 표시함으로써 맵상에서 데이터의 분포를 파악할 수 있고, 여러분이 사용하는 그리딩(Gridding) 방법의 정확성을 입증할 수 있습니다.
|
| |
 |
| |
| Post Map을 이용하여 X, Y 데이터의 위치를 표시한 예 |
 |
| |
| 각기 다른 범주의 데이터를 디스플레이 하기 위해 각각 다른 심볼을 사용한 분류화된 Post Map - 분류화된 Post Map을 Wireframe위에 중첩 도시하였고 3D 레이블 라인을 추가하여 Map Surface 위에 심볼들을 그렸습니다. |
| |
Post Map 관련 기능 및 특징 |
- Create any number of post maps on a single page
- Post from any number of files
- Use proportional or fixed size symbols
- Full control of symbol style, color, and frequency
- Post data on contour, vector, surface, or base maps
- Post every point or every nth point
- Rotate and tilt post maps to any angle
- Make a Classed Post Map to post different symbols for specified ranges of data values
- Create a classed post legend to display the symbols and data ranges
- Specify custom symbols from the worksheet
- Add labels from a data file and adjust the angle of the label and the plane in which the label appears
- Change data files without resetting post map and classed post map parameters
|
|
|
|
|
분수계(Watershed, 유역) 지도 만들기 |
|
| |
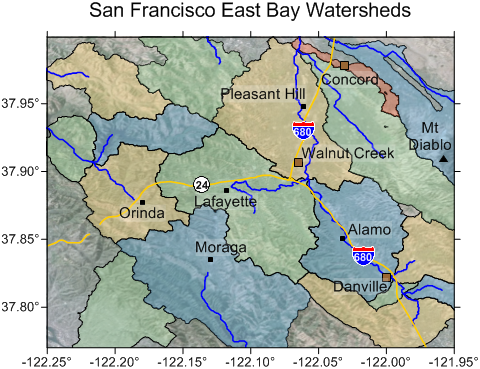
사용자의 격자 파일로부터 배수 유역과 하천을 자동 계산하여 표시합니다. 하천, 수 계(Stream System), 본류로 유출되는 영역을 다채롭게 표현할 분수계 지도를 만들 수 있습니다. 담수 유역, 하천 또는 둘 다 표시할 수 있습니다.
|
| |
 |
| |
| 영역이 어느 하천으로 유출되는지를 결정할 담수 유역과 하천을 표시 |
|
|
|
3D WireFrame Maps |
|
| |
| Surfer의 Wireframe Map은 여러분의 데이터를 3차원으로 멋지게 표현해 줍니다. 여러분이 원하는 정확한 Surface를 만들기 위해 Color Zone, 독립적인 X, Y, Z scale, 특정 기울기 또는 회전 각도에서 Orthographic 또는 Perspective projection을 그리고 다른 조합의 X, Y, Z 라인을 사용해 보십시오. Wireframe 위에 색으로 채워진 Contour Map을 씌워서 인상적인 칼라 혹은 흑백으로 여러분의 데이터를 멋있게 표현해 보세요. 표현할 수 있는 방법은 매우 다양합니다.
|
| |
 |
| |
wireframe
map은 X, Y, Z의 어떤 조합이든 디스플레이 할 수 있습니다.
위 그림은 USGS DEM을 이용하여
그린 지도이며, Color Zone은 X와 Y 라인을 위해 정의되었습니다. |
| |
3D Wireframe Map 관련 기능들
|
- Display any combination of X,Y, and Z lines
- Use automatic or user-defined color zones to highlight different Z levels
- Stack any number of 3D surfaces on a single page
- Optional hidden line removal
- Overlay any combination of contour, filled contour, base, post, and classed post maps on a surface
- Views of the top or bottom of the surface, or both
- Proportional or independent scaling in the X,Y, and Z dimensions
- Full control over axis tick marks and tick labels
- Add a base with optional vertical base lines
- Display the surface at any rotation or tilt angle
|
|
|
|
|
Vector Maps |
|
| |
| 지도상의 각 위치에서 데이터의 방향과 크기를 보여주는 Vector Map을 Surfer에서 매우 빠르게 그릴 수 있습니다. 하나 혹은 분리된 두 개의 그리드(Grids)속에 있는 정보로부터 Vector Map을 작성할 수 있습니다. 벡터 지도의 두 구성 요소인 방향과 크기는 표현된 Surface의 경사도를 계산함으로써 하나의 그리드로부터 자동으로 생성합니다. 어떤 특정 그리드 노드에서, 화살표의 방향은 경사가 가장 가파른 곳을 향합니다. 화살표의 크기는 경사의 가파른 정도에 따라 달라 집니다. 두 개의 Grid Vector Map은 각각 두 개의 그리드 파일을 이용하여 벡터의 방향과 크기를 결정합니다. 그리드들은 Cartesian(데카르트 곱) 혹은 Polar 데이터를 포함할 수 있습니다. Cartesian 데이터의 경우, 하나의 그리드는 X component 데이터로 구성되고 다른 그리드는 Y component 데이터로 구성됩니다. Polar 데이터의 경우, 하나의 그리드는 각도 정보를 다른 그리드는 길이 정보를 포함합니다. 보다 잘 묘사하기 위해 벡터 지도 혹은 Wireframe 지도를 중첩하여 표시할 수 도 있습니다.
|
| |
 |
|
St.
Helens 산의 벡터 지도를 Contour 지도위에 중첩 표시한 예.
Color Scale
Bar 혹은 Legend를 이용하여 화살표의 크기를 표시할 수 있음.. |
| |
| |
Vector Map관련 주요 기능들
|
- Define arrow style, color, and frequency
- Symbol color may be fixed or based on vector magnitude
- Display map scales, color scale bars, and vector scale legends
- Scale the arrow shaft length, head length, and width
- Control vector symbol origin
- Choose from linear, logarithmic, or square root scaling methods
|
|
|
|
|
Map Layers |
|
| |
지도 중첩(Map overlays)기능은 contour, wireframe, vector, base, post map 등 여러분이 원하는 수 많큼 병합하여 표시할 수 있습니다. 색으로 채워진 Contour Map을 Wireframe 위에 겹쳐 표시함으로써 멋진 3D 디스플레이를 만들어 냅니다. 그리고 여러분이 원하는 수 많큼 지도를 중첩할 수 있기 때문에 하나의 맵위에 많은 양의 데이터를 보여줄 수 있습니다.
|
| |
 |
| |
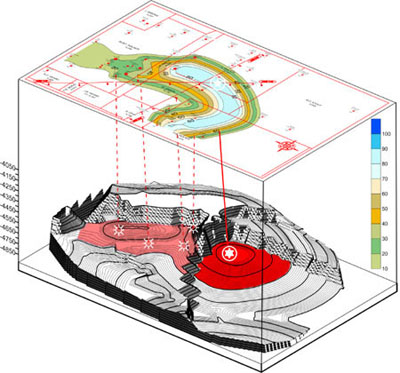
| 이 지도는 두 개의 Contour Map(Base Map과 Wireframe Map)을 중첩하여 만들어 오염 확산의 모습을 표현하고 있습니다. |
|
|
Stacking Maps |
|
| |
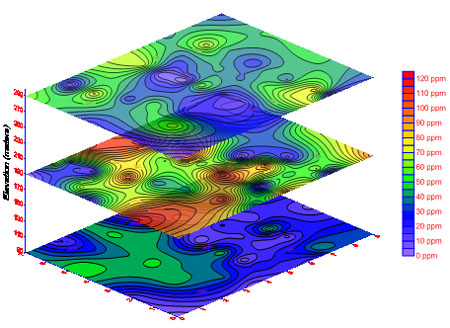
각 개별 지도들을 한 페이지에 쌓아서 정렬할 수 있습니다. Map Stacking 기능은 동일한 좌표 체계를 이용하여 지도들을 정렬하도록 설계되었습니다. 이 명령은 상대적 수평 위치를 유지하면서 두 개 이상의 지도들을 수직으로 분리하여 한 페이지에 표시할 때 유용합니다.
|
| |
 |
| |
| 다수의 2D 지도를 중첩하여 여러 레이어들을 볼 수 있음 |
 |
| |
| 지도들을 중첩 회전하여 최상의 프리젠테이션 효과를 얻을 수 있음 |
|
|
|
|
새로운 좌표 체계, 프로젝션 및 데이텀 |
|
| |
추가된 좌표체계
|
- State Plane 1983 - Kentucky Single Zone
- New Zealand Map Grid
- New Zealand Transverse Mercator 2000 (NZTM 2000)
- Irish National Grid
- Italy Mainland Zone 1 Gauss-Boaga
- Italy Mainland Zone 2 Gauss-Boaga
- Sardinia - Gauss-Boaga
- Sicily - Gauss-Boaga
- Switzerland - CH1903 LV03
- Switzerland - CH1903+LV95
- JGD2000 / Japan Plane Rectangular
- JGD2000 / UTM
|
|
|
| |
새로 추가된 프로젝션(Projection)
|
- New Zealand Map Grid
- Updated Hotine Oblique Mercator
- Updated Hotine Oblique Mercator 2-Point
|
|
|
| |
새로 추가된 프로젝션(Projection)
|
- Rome 1940 - Italian Peninsula (Greenwich Meridian)
- Rome 1940 - Sardinia (Greenwich Meridian)
- Rome 1940 - Sicily (Greenwich Meridian)
- New Zealand Geodetic Datum 1949 (Bursa-Wolf)
- New Zealand Geodetic Datum 2000 (NZGD2000)
- CH1903 - Switzerland (Bursa-Wolf)
- CH1903+ - Switzerland
- ITRF90 (Bursa-Wolf)
- ITRF94 (WGS84 base)
- Japan Geodetic Datum JGD2000 (WGS84 base)
|
|
|
|
|
프로파일(Profiles) 자동 생성 |
|
| |
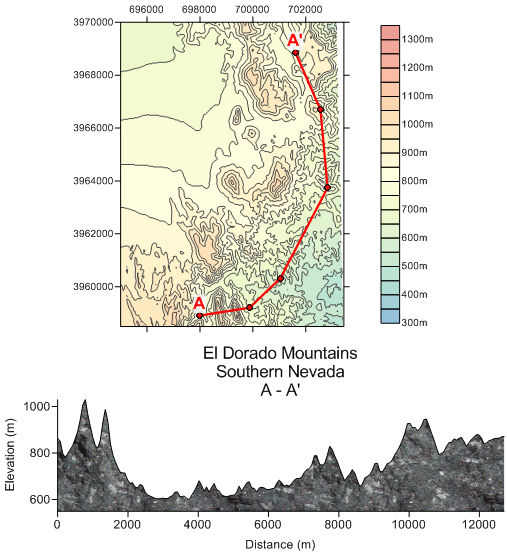
한 지점에서 다른 지점까지의 높이(z) 값을 쉽게 표출할 수 있습니다. 지도상의 프로파일 선 모양을 바꿀 수 있고 즉시 업데이트 할 수 있습니다.
|
| |
 |
| |
| 지도 위에 단순히 선을 그림으로써 프로파일을 쉽게 만들 수 있음 |
|
|
|
Customize Your Map |
|
| |
여러분의 목적에 맞게 지도를 커스터마이징하여 가장 보기 좋게 만들어 보세요. Surfer는 매우 많은 지도 기능들을 제공하여 여러분의 지도 모양을 최상으로 만들어 줍니다. Sufer의 기본 설정 또는 사용자 맞춤 지도를 만들 수 있는데, 축척 바, 색상 편집, 선/채우기 스타일, 지도의 일부만 보이기, 축척 조절, 축 속성 설정 등 다양한 옵션들을 조절할 수 있습니다.
|
| |
주요 기능 |
- Change the tilt, rotation and field of view angle for the map
- Specify the view projection as perspective or orthographic
- Set XYZ scales in map units or page length
- Choose proportional or independent XY scaling
- Display the map using the data XY limits or choose to display the map using a subset of the data
- Control background fill and line color and styles
- Full control over the axis limits and scaling, axis title, axis line style, tick labels, tick spacing, tick display, and grid lines
|
|
|
| |
다른 커스터마이징 기능들 |
- Create any number of maps on a single page
- Create independent maps or create a combined map with multiple types of map layers
- Add scale bars
- Add additional axes
- Add text, polylines, polygons and symbols
- Edit text, line, fill and symbol properties
- Set the transparency for images, fill patterns and most map layers
- Define custom line styles and colors
- Add any number of text blocks at any position on the map, using
- TrueType fonts
- Include superscripts, subscripts and Greek or other characters in text
- Add arrowheads to lines
|
|
|
| |
 |
| |
| Surfer가 제공하는 다양한 옵션을 이용하여 여러분의 지도를 커스터마이징해 보세요 |
 |
| |
| 텍스트,
축척 바, 지도 배치 등 다양한 옵션들을 이용하여
정보가 가득한 지도를 만들어 보세요 |
|
|
Gridding |
|
| |
Surfer에서 제공하는 Griddin 방법들은 XYZ데이터로부터 정확한 Contour, surface, wireframe, vector, image, 그리고 음영 기복도 등을 생성할 수 있게 해줍니다. 지도위에 데이터를 무작위로 흩뿌릴 수 있고, Surfer의 그리딩은 여러분의 데이터를 그리드상에 내삽(Interpolate)할 수 있습니다. 여러분이 사용할 수 있는 그리딩 방법은 다양하기 때문에 여러분이 원하는 맵을 정확하게 만들 수 있습니다. 각각의 그리딩 방법들을 이용하여 그리딩 파라피미터를 완벽하게 제어할 수 있습니다. 이미 여러분의 데이터가 규칙적인 사각형 배열로 모아졌다면 데이터로 부터 바로 맵을 만들 수 있습니다.
|
| |
Gridding 관련 기능 및 특징 |
- Interpolate from up to 1 billion XYZ data points (limited by available memory)
- Produce grids with up to 100 million nodes
- Specify faults and breaklines when gridding
- Choose from one of the powerful gridding methods: Inverse Distance, Kriging, Minimum Curvature
- Polynomial Regression, Triangulation, Nearest Neighbor, Shepard's Method, Radial Basis Functions, Natural Neighbor, Moving
Average, and Local Polynomial
- Specify isotropic or anisotropic weighting
- You have full control over the grid line geometry including grid limits, grid spacing, and number of grid lines
- Customize search options based on user-defined data sector parameters
- Specify search ellipses at any orientation and scaling
- Use spline smoothing and grid filtering to alter the grid file
- Use grid math to perform mathematic operations between grid files
- Use Nearest Neighbor to create grid files without interpolation
- Use Triangulation to achieve accuracy with large data sets faster
- Detrend a surface using Polynomial Regression, generate regression coefficients in a report, and calculate residuals
- Use data exclusion filters to eliminate unwanted data
- Use duplicate data resolution techniques
- Generate a grid of Kriging standard deviations
- Specify point or block Kriging
- Generate a report of the gridding statistics and parameters including ANOVA regression statistics
- Specify scales and range for each variogram model
- Extract subsets of grids or DEMs based on rows and columns
- Transform, offset, rescale, rotate, and mirror grids
- Calculate first and second directional derivatives at user-specified orientations
- Calculate differential and integral operators utilizing gradient, Laplacian, biharmonic, and integrated volume operators
- Analyze your data with Fourier and spectral analysis with Correlograms and Periodogram
- Generate grids from a user-specified function of two variables
- Calculate grids with Data Metrics including: number of points within search ellipse, distance to nearest and farthest neighbor,
median, average and offset distance to points within the search ellipse
- Use cross-validation to judge the suitability of the gridding method for the particular data set
|
|
|
| |
Gridding 함수들 |
| 지도를 생성 기능이외에, 그리드 파일들을 이용하여 다양한 기능들을 수행할 수 있습니다.
|
|
|
- Calculating the volume and areas of grid files! You can calculate the planar and surface area, and calculate the volume between two grid files, or a grid file and any horizontal plane.
- Applying a mathematical equation to grid files. Examples include subtracting one grid file from another to create an isopach map,
- converting outliers to a minimum or maximum value, or multiplying one grid file by a conversion factor to convert the Z units from
- meters to feet.
- Applying grid filters to emphasize details or remove background variation in the grid file.
- Blanking specified regions in a grid file to prevent contours or map data from being drawn through those areas
(ie. buildings, roads, or outside of field areas).
- Creating cross sections and topographical profiles.
- Combining multiple grid files into a single, easy to use grid file.
- Extracting subsets of grids or DEMs based on rows and columns.
- Transforming, offset, rescale, rotate, and mirror grids. Smoothing grid files to create smoother maps.
- Calculating first and second directional derivatives at user-specified orientations.
- Calculating differential and integral operators utilizing gradient, Laplacian, biharmonic, and integrated volume operators.
- Analyzing your data with Fourier and Spectral Analysis with Correlograms and Periodogram.
- Calculating residuals to find the difference between the original data point values the interpolated Z values at those points, or to
find the Z values at any specific XY locations.
- Interactively editing individual grid node values.
|
|
|
| |
Surfer에서 제공하는 Griddin 방법들은 XYZ데이터로부터 정확한 Contour, surface, wireframe, vector, image, 그리고 음영 기복도 등을 생성할 수 있게 해줍니다. 지도위에 데이터를 무작위로 흩뿌릴 수 있고, Surfer의 그리딩은 여러분의 데이터를 그리드상에 내삽(Interpolate)할 수 있습니다. 여러분이 사용할 수 있는 그리딩 방법은 다양하기 때문에 여러분이 원하는 맵을 정확하게 만들 수 있습니다. 각각의 그리딩 방법들을 이용하여 그리딩 파라피미터를 완벽하게 제어할 수 있습니다. 이미 여러분의 데이터가 규칙적인 사각형 배열로 모아졌다면 데이터로 부터 바로 맵을 만들 수 있습니다.
|
|
|
향상된 격자 노드(Grid Node) 편집기 |
|
| |
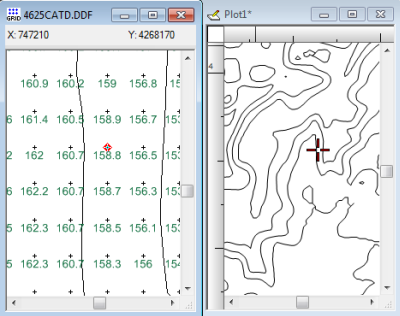
격자 노드 편집기(Grid Node Editor)가 보다 강력해졌습니다! 툴 바에 있는 도구들을 이용하여 줌인/줌아웃을 할 수 있고, 줌인 할 때 격자 노드의 Z 값을 표시할 수 있습니다. 커서 트래킹을 활성화 한 후, 격자 노드 편집기 창에서 어느 한 노드를 클릭하면 플롯(Plot) 창에서 지도의 동일 위치가 강조되어 표시 됩니다.
|
| |
 |
| |
| 플롯 창에서 지도 위에서 커서 위치를 동시에 트래킹함으로써
편집하고 있는 격자 노드 위치를 정확히 할 수 있음. |
|
|
|
Variograms |
|
| |
하부 체계(Subsystem)을 모델링하는 Variogram을 사용하여 공간 연속 데이터를 정량적으로 평가할 수 있습니다. Variograms는 Kriging 알고리즘으로 그리딩할 때 적합한 Variogram을 선택해 줍니다. Surfer는 Variogram 그리드를 기본 내부 데이터 표출로 사용하며 일단 이 그리드가 만들어지면, 어떤 실험적인 Variogram이든 즉시 계산됩니다.
|
| |
 |
| |
| 데이터의 공간 연속의 정량적 분석을 위해 Variogram을 즉시 생성합니다 |
| |
Variogram 관련 기능 및 특징 |
- Virtually unlimited data set sizes
- Display both the experimental variogram and the variogram model
- Specify the estimator type: variogram, standardized variogram, auto covariance, or auto correlation
- Specify the variogram model components: exponential, Gaussian, linear, logarithmic, nugget effect, power, quadratic, rational
quadratic, spherical, wave, pentaspherical, and cubic models
- Customize the variogram to display symbols, variance, and number of pairs for each lag
- Export the experimental variogram data Download variogram tutorial
-
Download variogram tutorial
|
|
|
|
|
Faults and Breaklines |
|
| |
여러분의 데이터를 격자화(gridding)할 때 Fault 와 Breakline을 정의합니다. Fault가 있는 부분의 데이터는 다른 Fault가 있는 부분의 그리드 노드 값을 계산할 때 사용되지는 않습니다. 격자화 알고리즘이 Breakline을 발견하면, Breakline 바로 위에 있는 데이터 포인트들은 내삽(Interpolated)된 값을 취합니다. Breakline을 이용하여 유선(Streamlines), 능선(Ridges),그리고 경사에서 다른 단절(Break) 등 을 정의합니다. Faults와는 달리 Breaklines은 정보의 흐름의 장벽이 아니며, 격자 알고리즘은 반대편의 한 점을 사용하기 위해 Breakline을 횡단할 수 있습니다. Faults를 지원하는 격자화 방법들에는 - Inverse Distance to a Power, Minimum Curvature, Nearest Neighbor, Data Metrics 등이 있습니다. Breaklines을 지원하는 방법들에는 - nverse Distance to a Power, Kriging, Minimum Curvature, Nearest Neighbor, Radial Basis Function, Moving Average, Data Metrics, Local Polynomial gridding 방법 등이 있습니다.
|
| |
 |
| |
| Fault의 특징을 그린 Contour map을 그린 예. 데이터를 격자화할 때 Faults 와 breaklines 이 구체화되었습니다. |
|
|
USGS DEM(Digital Elevation Model) Files |
|
| |
- Use DEM files with any Surfer command that uses GRD files
- Directly use the SDTS DEM file format in native form
- Display information about the DEM
- Create contour, vector, shaded relief, image, and wireframe maps from DEM files
|
|
|
|
Worksheet |
|
| |
Surfer는 데이터 작성, 읽기, 편집, 저장에 필요한 모든 기능을 갖춘 워크시트를 제공합니다. 데이터 파일을 최대 10억줄까지 가능하며, 컴퓨터의 메모리에 따라 처리 가능한 데이터가 제한적일 수 있습니다. Window의 클립보드 기능을 사용할 수 있기 때문에 Surfer의 워크시트 또는 응용 프로그램 사이에서 데이터 자르기, 복사, 붙이기 등을 할 수 있습니다.
|
| |
Worksheet 관련 기능 |
- Import files in DAT, TXT, SLK, XLS, WKx, WRx, CSV, BNA, or BLN formats
- Calculate data statistics
- Perform data transformations using advanced mathematical functions
- Sort data based on primary and secondary columns
- Print the worksheet
- Save your data in one of the following formats: XLS, SLK, CSV, TXT, DAT, BLN, and BNA
|
|
|
|
|
Object and Property Manager |
|
| |
Object Manager는 어떤 오브젝트의 편집이든 단순화시켜 줍니다. 모든 오브젝트를 사용이 편리한 계층적 트리 구조내에서 보여줍니다. Object Manager에 있는 Object를 선택하면 쉽게 편집할 수 있고, 보이게 하거나 감출 수 있습니다.
|
| |
 |
| |
| Object Manager를 이용하여 쉽게 접근하여 Plot Window에 나타난 모든 오브젝트들을 편집할 수 있습니다. |
|
|
Automation |
|
| |
사실상 여러분이 인터렉티브하게 실행할 수 있는 어떤 조작도 자동화 호환 가능한 언어(Visual Basic, C++, Perl 등)를 사용하여 제어할 수 있습니다. GS 스크립터(Visual Basic 호환 프로그래밍 환경)을 제공하여 여러분이 스크립트를 직접 작성, 편집, 수정, 실행할 수 있습니다. 이러한 방법으로 반복적인 작업을 자동화할 수 있고, Surfer에서 제공하는 어떠한 작업도 수행할 수 있습니다.
많이 사용되는 몇몇 스크립트를 무료로 활용하실 수 있습니다. 이들 자료를 다운받으시려면 여기를 클릭하십시오.
|
|
|
System Requirements |
|
| |
- Export maps in DXF, SHP, BNA, BLN, MIF, GSI, GSB, EMF, WMF, CLP, CGM, TIF, BMP, JPG, TGA, PNG, PCX, DCX, WPG, PCT,
formats
- Windows Clipboard support for copying maps to other applications
- Combine any number of maps on a single page
- Use the mouse to resize objects on the screen
- Define default preferences
- Define custom line styles and colors and save for use on other maps
- Add any number of text blocks at any position on the map, using TrueType fonts
- Include superscripts, subscripts and Greek or other characters in text
- Compute volumes, planar and surface areas
- Calculate residuals between data and surface
- Print to any Windows supported printer or plotter
- Easily clip boundaries or posted points to contour map limits
- Display and print subsets of completed maps, complete with subset axes
- Add arrowheads to lines
- Adjust the number of undo levels
- Use the reshape tool to edit areas and curves
- Floatable toolbars
|
|
|
|
Supported File Formats |
|
| |
새롭게 지원되는 입력 파일 형식
|
- LiDAR LAS 형식의 데이터 파일 읽기
- E00 과 GRIB 형식의 Grids 읽기
- 압축된 SDTS 파일의 Grids를 직접 읽기(TAR, TAR.GZ 형식)
- GPX 파일을 베이스 맵으로 가져오기
|
|
| |
새롭게 지원하는 내보내기 형식 또는 향상된 내보내기 형성
|
- 데이터를 XLSX 형식으로 저장
- Grids를 CPS-3 또는 ZMAP 형식으로 저장
- GeoPDF 파일로 내보내기
- PDF로 내보낼 때 부분 투명도 및 페이지 크기 설정 지원
- Turning off the axes won't create extra white space around the map after exporting to image file! You don't have to turn off tick
marks/labels before export to image anymore. 축 설정 해제하면, 이미지 파일로 내보낸 후에 지도 주변에 추가 흰 공백을 만들지 않습
다. 이미지 파일로 내보내기 전에 눈금 표시/라벨 등을 해제 하지 않아도 됩니다.
|
|
|
|
|
Digitize Boundaries |
|
| |
- Find XY coordinates
- Automatically write coordinates to ASCII data files
- Automatically save digitized coordinates as BLN files
- Create boundary files for use with other maps
- Display different properties for base map features
|
|
|
|
Supported |
|
| |
- PC running Windows 98, Me, 2000, XP, or higher
- 25 MB of free hard disk space
- 32 MB RAM minimum, 64 MB or higher recommended
- 800 x 600 minimum monitor resolution
|
|
|
Surfer
데모 버전 다운 받기 |