
연구의 선진화와 생산성 향상에
필요한 최적의 소프트웨어와 컨설팅을
공급하도록 노력하겠습니다.
필요한 최적의 소프트웨어와 컨설팅을
공급하도록 노력하겠습니다.


Visilog 7.0 새로운 기능들
이번 Visilog 7.0에서는 인터페이스에서도 상당한 개선이 이루어졌고, 새로운 알고리즘들이 많이 추가 되었습니다.
주요 업데이트 내용:
- Windows 7 64-bit 지원
- 더욱 향상된 성능
- 학습에 의한 분류 기능을 수행하는 강력한 기능 추가
- 새로운 영상처리 알고리즘 추가
Windows 7 64-bit와 완벽한 호환
- 모든 프로세서에서 30% 이상의 속도 개선
- 64 bit에서 VBA(Visual Basic 스크립트) 이용 가능
- 수 GB의 영상을 메모리에 로딩 가능
- 모든 호환 가능한 카메라(1394, WDM 또는 Maxtrox카드로 제어되는)를 제어할 수 있음

학습(training)을 통한 자동 모양(blobs) 분류
 데모보기
데모보기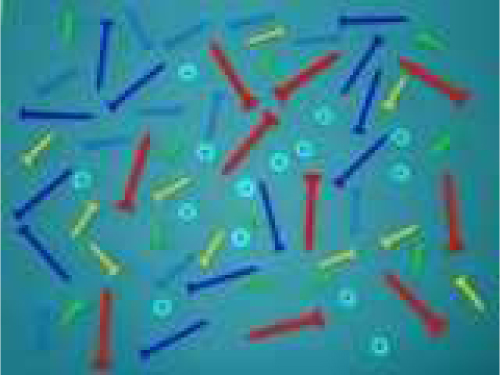
- 모양, 질감(texture)이나 강도(intensity)에 기초하여 잠재적으로 차별적인 측정을 선택
- 이용 가능한 측정 목록을 풍부하게 하는 가능성
- Training(학습) set을 적용한 규칙으로 자동 생성
- 차별 측정에 의한 자동 추출
- 생성된 규칙을 적용하여 모든 영상을 자동 분류

어떤 사용 레벨에서든 풍부해진 프로세스 라이브러리
- 프로세스 획득을 단순화할 수 있는 매크로 명령어들
- removalsmallholes : 객체들 안에 존재하는 작은 구멍(holes)을 채우는 명령
- removalsmallspots : 작은 객체들을 제거
- mergemask : 바이너리 마스크에 기초하여 두 영상을 혼합할 수 있음.
- 스레쉬홀드 기법을 보다 정교하게 할 수 있는 새로운 기능
- adaptative_threshold : 스레쉬홀드 값들을 설정하기 위해 영상의 특정 부분의 히스토그램을 사용할 수 있음.
- "고급" 기능들
- 필터링과 형태 처리에 선형, 원형, 또는 구형과 같은 어떤 유형의 커널도 적용하여 사용할 수 있음.

인터페이스 개선
- 명령어들을 보다 쉽게 다룰 수 있도록 각 파라미터들에 대한 툴팁을 제공
- 측정 그룹 생성 창 개선
- 영상의 일부 영역을 확대할 수 있는 새로운 기능 추가
- CTRL+R 조합의 폴리곤 또는 타원으로부터 영상의 일부를 추출할 수 있음.
- 스프레드시트에 그래프 및 점 그리기 기능이 향상됨.

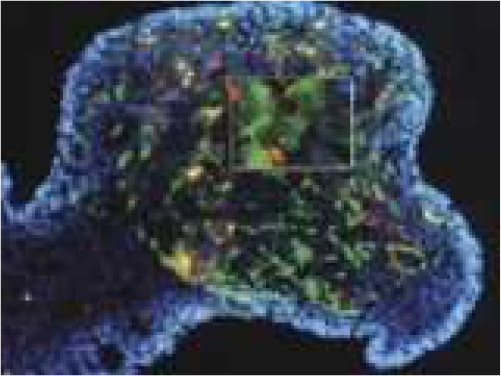
새로운 3D 도구들
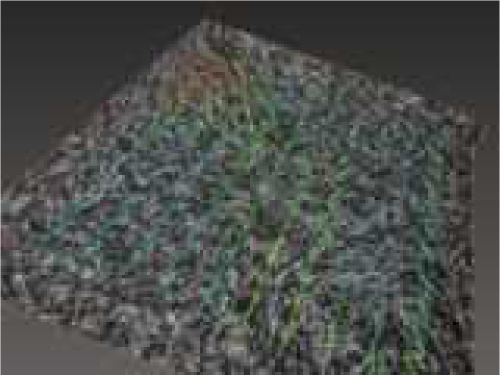
- 3D에서 섬유(fibers)의 위치를 자동 결정하는 새로운 명령어들 추가
- 근린 선형, 원형, 구형에 기초한 형태학(Morphology) 및 필터링 기법 추가
- 명령어 Corner3d 를 이용한 관심 포인트들을 추출
- gradient 3D 최적화
- 3D 창 디스플레이를 싱크로나이즈할 수 있는 기능 추가
- 3D에 대한 일반적인 영상 편집 도구들

Visilog 6.6의 새로운 기능들
인터페이스와 알고리즘들이 많이 개선되었습니다.Visilog를 StandAlone 형태로 사용 가능
- It is now possible to use Visilog commands from a Visual C++ project.[Toolkit 버전에서만 가능]
애니메이션 다루기
- TEnhancement of the intensity profile administration, for instance in multi_profiles mode
- Possibility to formate the text associated with the annotations
- ROI enhancement: holes and multiple selection management, in interactive measures as well as in individual analyse (drawing mode)
- Possibilty to use the wand on 3D images
Viewer
- Addition of the display context in Gamma
Processing
- Algorithmic enhancement for the regions management
- Possibility to restric the levelsets propagation
Spread Sheet
- Formated exportation of the data toward Excel (sizes, colors, ...)
- Tools to modify the current curve
Acquisition
- Enhancement of WDM driver, especially for USB2 cameras
- Enhancement of IEEE1394 driver : support of IEEE1394b cameras
- Support of SPOT digital cameras, allowing captures of 2048x2048 images
Customizing Visilog
- Possibility to define up to 10 user toolbars
- Possibility to replace Visilog's name by the name of a specialized application (Tool Kit et Runtime)
- Possibility to modify the application icon (Tool Kit et Runtime)
- Possibility to add a toolbar in the image visualisation window (Tool Kit et Runtime)
Visilog 6.5의 새로운 기능들
Viewer
- Stop button in the status bar to stop image loading and VBA macro
- Possibility of forcing the loading in memory of the sequences and the 3D images.
- Possibility to put any image in overlay with a transparency effect Demonstration
- Possibility to save overlay images of any size, type and origin in the .im6 format
- Synchronization of measures linked to distance object (Viewer and ResultViewer)
- Adding Spline annotation
- Levelsets available for 2D images
- Propagation control tool of Magic wand and Levelset
- Ctrl+T create a region like Ctrl+R but keeps the origin of the AOI
- Multi-sources images management Demonstration
Result Viewer
- Histogram calculation in percentage or number
- User measure interface: new **, gx, gy, gz buttons and Unit choice
- Possibility to change the display format of numerical values
- 1D processes: display of the Gaussian approximation Demonstration
2D Commands
- The commands on sequence and 3D disk images are mush faster
- Possibility to analyze sequences (I_analyzeseq) Demonstration
- Possibility to analyze color and multi-sources images Demonstration
- Adding bayer2rgb command to convert a Bayer image to a RGB image
- Adding calimg2img to convert a image with a intensity calibration to a greyscale image
- New gradient command
- Adding bkgimg to compute a background image via a bilinear interpolation
3D Commands
- Magic Wand operates in 3 dimensions Demonstration
- Iso-surface mode to get a volumic visualisation of 3D images
- Adding Z symmetry
- Adding translate3d and transpose3d commands
- fft commands runs in 3D for any image size