연구의 선진화와 생산성 향상에
필요한 최적의 소프트웨어와 컨설팅을
공급하도록 노력하겠습니다.
WindRose>> A software for wind data analysis.

Welcome to WindRose

WindRose is an add-in to Microsoft's Excel for the analysis of wind data. It reads ASCII data (a file format produced by every data-logger, LIDAR or SODAR) and displays the analysis results into Excel spreadsheets.

Example of WindRose integration to Excel


The results of the analysis comply with the existing standards in the Wind Energy sector (i.e.: IEC 61400-1 & -12, MEASNET Site Assessment).

WindRose is used by the majority of greek developers, consultants, academic institutes, as well as, by many companies worldwide (United States, Australia, Canada, France, UK, Italy, Spain, Turkey, Cyprus, Slovenia, Costa Rica, Equador, S. Korea, Jordan, Serbia, Namibia).

The software is developed and commercialized by C.R.E.S., the Greek Centre for Renewable Energy Sources.

Wind Data Analysis

WindRose provides a wide range of specialized statistical results dedicated to wind data analysts.

Wind data distribution

Main features:

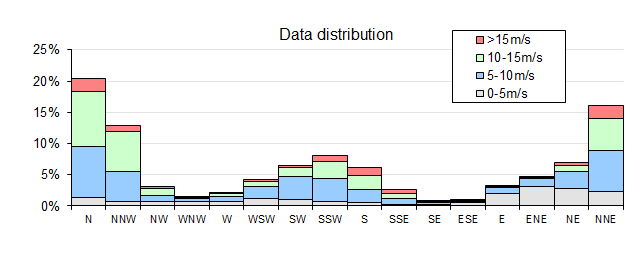
  • Classic wind data analysis (mean values, gusts, time and energy wind roses, Weibull distribution, air-density corrections, 1h-autocorrelations, ...)
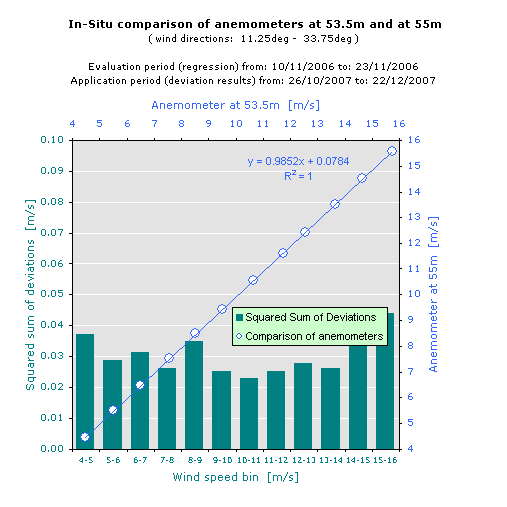
  • In-situ anemometer calibration results (Annex-K of IEC 61400-12).
  • Data filtering (automatic or manual).
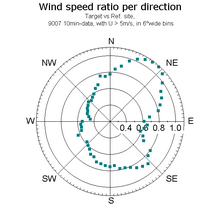
  • Wind shear and veer investigation.
  • Raw data visualization with zoom capability.
  • Various diurnal distributions (grobal or per month) for the wind speed or the shear.
  • Representative or characteristic turbulence intensities tables.
  • Capacity factor and annual production estimation of a wind turbine, at the measurement location.

   Correlations

When concurrent data exist from two sites, WindRose correlation results (MCP-matrix method) include :

  • Calculation of the the time-shift that maximizes the wind speed correlation.
  • Correlation and regression coefficients per each direction sector and wind speed bin (range).
  • Predicted time-series for filling data gaps.
  • Linear and Polar plots of the wind speed ratios.
  • Turbulence intensities correlations.

Other features:

  • Accepts time-series with different time-steps (ie: 10min and 1h).
  • Outputs the concurrent data set as a single table.
  • Easy location of periods with high/low correlations.