MapViewer
7의 새로운 기능과 특징 New
Map Types
MapViewer 7 introduces three new types
of thematic maps - Contour Map, Non-Contiguous Cartogram, and Vector
Map.
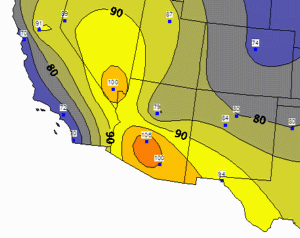
| Contour
Map
MapViewer can take discrete data measurements, interpolate between
them to create a uniform grid, and then display a contour map
showing lines of constant values. You have complete control over
the appearance of the contour map and can easily limit the contours
to your area of interest. |
|
|
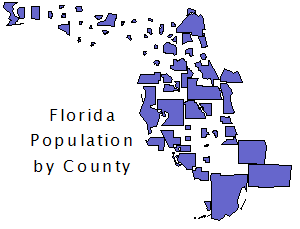
| Non-Contiguous
Cartogram
Cartograms represent data values by changing the size of the associated
area object. In addition to the existing Dorling cartogram, MapViewer
7 can now create a non-contiguous cartogram, where the original
shapes are retained but resized according to their data values.
Cartograms are particularly useful when there is an inverse relationship
between area and the data value. They emphasize the areas with
the greater data values. |
|
|
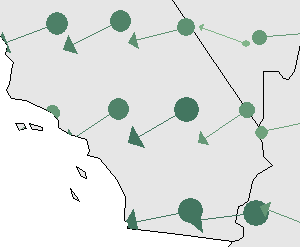
| Vector
Map
Like a contour map, a vector map also interpolates from discrete
data measurements to create a uniform grid. It then displays arrows
that indicate the direction and magnitude of the steepest slopes
across the grid. You can control the frequency and appearance
of the arrows. |
|
|
Insets
An inset is a display frame that is positioned
on a portion of the page. One or more layers can be assigned to be displayed
within an inset. Objects within an inset retain their original coordinates
even as the inset frame is moved on the page. The display within the
inset frame can be zoomed and panned.
Besides using an inset to enlarge a portion
of a map to show more detail, insets can also be used to:
- Show an overview of the whole map when a portion of the map is enlarged.
- Apply limits to one or more layers while other layers remain unlimited.
- Move/resize Alaska and Hawaii in a 50-state map without changing
their coordinates.
- Show multiple thematic maps on different parts of the page while
maintaining the original coordinates.
City/State Pin Maps
Making a pin map to show US city locations
is easier than ever! Besides the ability to make pin maps from X,Y coordinates
or from ZIP codes, MapViewer 7 can now make a pin map based just on
city and state names.
Pie Map Enhancements
Pie maps are more versatile than ever!
The radius of each slice can be varied instead of or in addition to
varying the slice percentage. You have your choice of pie shapes to
most effectively display your data.
Print Preview for Tiled Printing
When your map fits on a single page, MapViewer
has always had a print preview capability because of showing the page
outline around the map. For the case where your map is larger than the
page, MapViewer 7 adds a print preview for tiled printing. You can see
how the map will be divided between pages and can choose exactly which
tiles to print.
Negative Buffer Distances
The buffer tool in MapViewer 7 has been
enhanced to allow a negative buffer distance. You can create a buffer
zone inside of an area to show a setback distance.
Additional New Features
- Changes to existing thematic map types
- Several maps offer new options for displaying negative data values.
- Several maps allow mapping the minimum size to
a value of zero rather than to the data minimum.
- The gradient map now provides precise control of
mapping colors to data values.
- Grids and triangles can be saved from a gradient
map.
- Objects can be assigned to territories in a Territory
Map based on a linked data value.
- Territory assignments can be saved to the linked
data file.
- Geographical summaries are now available in a Territory
Map.
- Pin map changes
- A condition can be specified to filter data points.
- Projection information can now be specified for
non-Lat/Long coordinates.
- Import/Export enhancements
- Multi-layer imports can optionally either preserve or collapse layers.
- PIDs can be auto-generated if they don't exist.
- Z level info can be imported from DXF files.
- An associated attribute table can be loaded to
a linked worksheet.
- Export to DAT format.
- Export only current view.
- Choice of units when exporting projected map objects.
- Control is provided over what attributes and linked data are exported.
- Boundary creation changes
- Weighted Mean Center calculation.
- Spline objects remain as splines and can be edited as such.
- Spline objects now have a tension control.
- Layer management enhancements
- The Layer Manager has been redesigned to make it
easier to use and to show additional information.
- Layer destination lists now include a [New Layer] choice.
- User interface conveniences
- The Move/Resize tool icon can be double-clicked
to invoke it in a multiple-use mode.
- All file open, save, import, and export dialogs
can be resized.
- Legends, scale bars, and text objects can be double-clicked to open their associated dialog box.
- Double-clicking in the map window will open the
map properties dialog.
- Analysis enhancements
- A region can be created from the current
selection.
- The Shortest Path command now has an option to
return the path to the starting point.
- Object attribute changes
- Attribute 1, Attribute 2 and Hyperlink attributes
can now be assigned to additional object types.
- The Redefine Attributes command can now copy data
values from a linked worksheet to the attribute fields.
- The Multi-Assign Attributes command can auto-generate incrementing IDs.
- Miscellaneous
- The File | Reload Data command will reload the
data file that is linked to the active layer.
- Street intersections are now supported by the geocoding function.
- New worksheet Data | Text to Number and Data |
Number to Text commands.
- And many more!
|